
Pierluigi asked Gill for help with revising a conceptual figure that had previously been used in both a poster and a PowerPoint presentation but was now to be included in an article and submitted to a print journal. The figure was relatively complex, as it explained the experimental procedures used in his research, and Pierluigi was concerned that, without him being present to verbally explain the figure, it may be difficult to understand.
The figure differs from other conceptual figures discussed on this blog, as the visual elements it contains are all screengrabs taken from specialist scientific software. As these screengrabs show real data results, taken from the experimental procedures, or are screengrabs taken from commercial brain atlases, they cannot be replaced by drawn elements (see this blog post for a discussion on when drawing data may be appropriate). Despite the lack of drawn visual elements, the figure does raise issues that should be considered for any conceptual figure and are worth discussing here.
Please note that, to avoid any potential copyright issues (current or future), figures are shown without any text. The areas of text are instead represented by grey boxes.
The original figure is shown below:
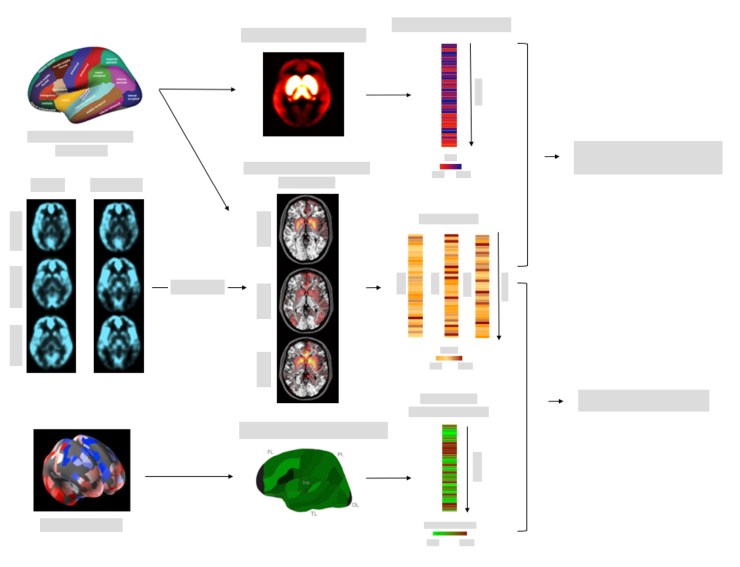
Pierluigi did explain the scientific meaning of the figure to Gill, to allow her to make informed decisions about the graphic design. But for the purposes of this blog post, the figure will be discussed purely from a graphic design viewpoint, without describing the science. Pierluigi was concerned that the figure should be read in the correct order, so leading a viewer through the figure is the most important job of the design. On that basis, the points listed below were discussed, with a revised figure included at the bottom of this post.
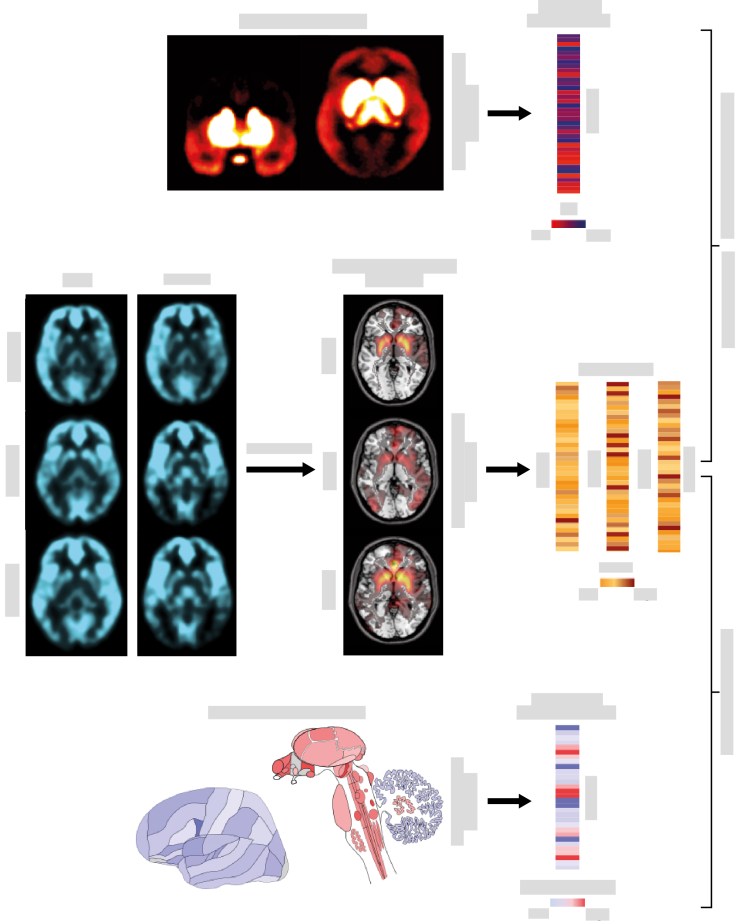
- The figure will be printed in colour and, to fit in with the publishing journal guidelines, can be no more than 178mm wide, so space is at a premium. With that in mind, the two text boxes on the right side of the figure are taking up too much of that space. Rotating the boxes through 90 degrees reduces that space, while still retaining legible text. The small arrows can be reduced to tick marks on the square brackets, saving more space. Other unnecessary arrows are also removed.
- The brain images at top left and bottom left are merely illustrative, representing two different brain atlases. Including them in the figure makes it overly complicated, as the brain in the top left is where a viewer would naturally look to start reading the figure, when in fact it is the blue MRI scans positioned in the middle left that start the experimental procedures. Therefore, the illustrative brains can be removed, together with the arrows to their right, and the atlases can be described by using text elsewhere in the figure. Do not be afraid to leave white space in a figure, provided it helps the overall visual communication.
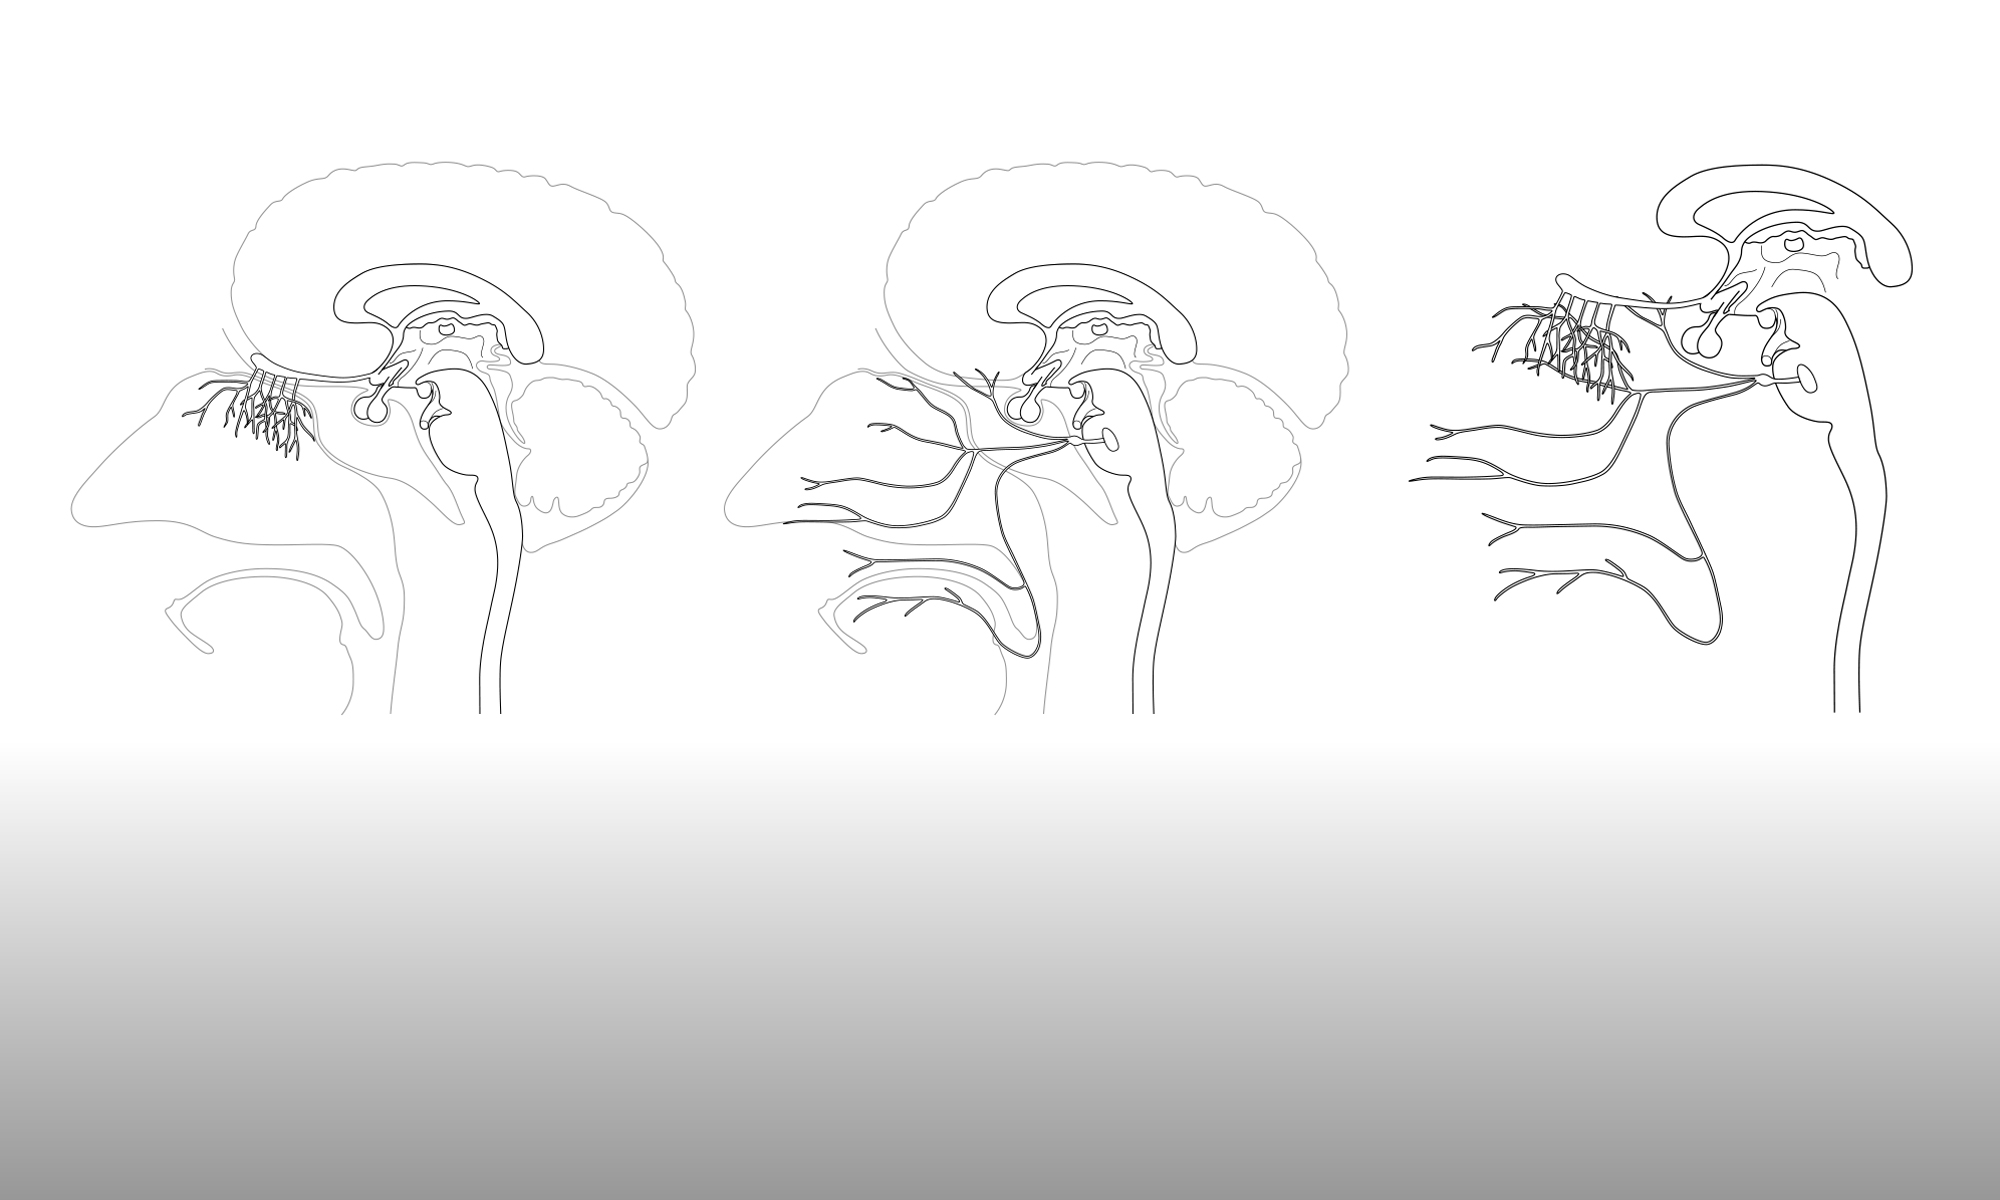
- The green brain cortex in the bottom row, and the green/red profile to its right, use colours that may be difficult to distinguish if a viewer is red-green colour blind. Also the dark green colours make it difficult to see the dividing lines within the cortex. Replacing the dark green/red colour scheme with a lighter red/blue scheme resolves both of those issues and gives a more harmonious look to the figure as a whole. An additional visual element (the brainstem and cerebellum) is included to demonstrate the colour range more clearly and any text captured within the screengrabs is also removed to simplify the figure.
- Lining up the visual elements both vertically and horizontally demonstrates more clearly which steps are happening when (steps 1, 2 and 3 reading from left to right) and which visual elements represent which experimental procedure (procedures 1, 2 and 3, reading from top to bottom). So, step 1 is performed for procedure 2 only, step 2 is performed for all three procedures, then step 3 is performed for all three procedures.
As can be seen in the revised version of the figure, the improved use of space allows the data visual elements to be much larger relative to the figure as a whole, whilst removing unnecessary elements simplifies the visual communication.
This is not the final version of the figure, but it shows what can be achieved simply by rearranging or revising existing visual elements.
