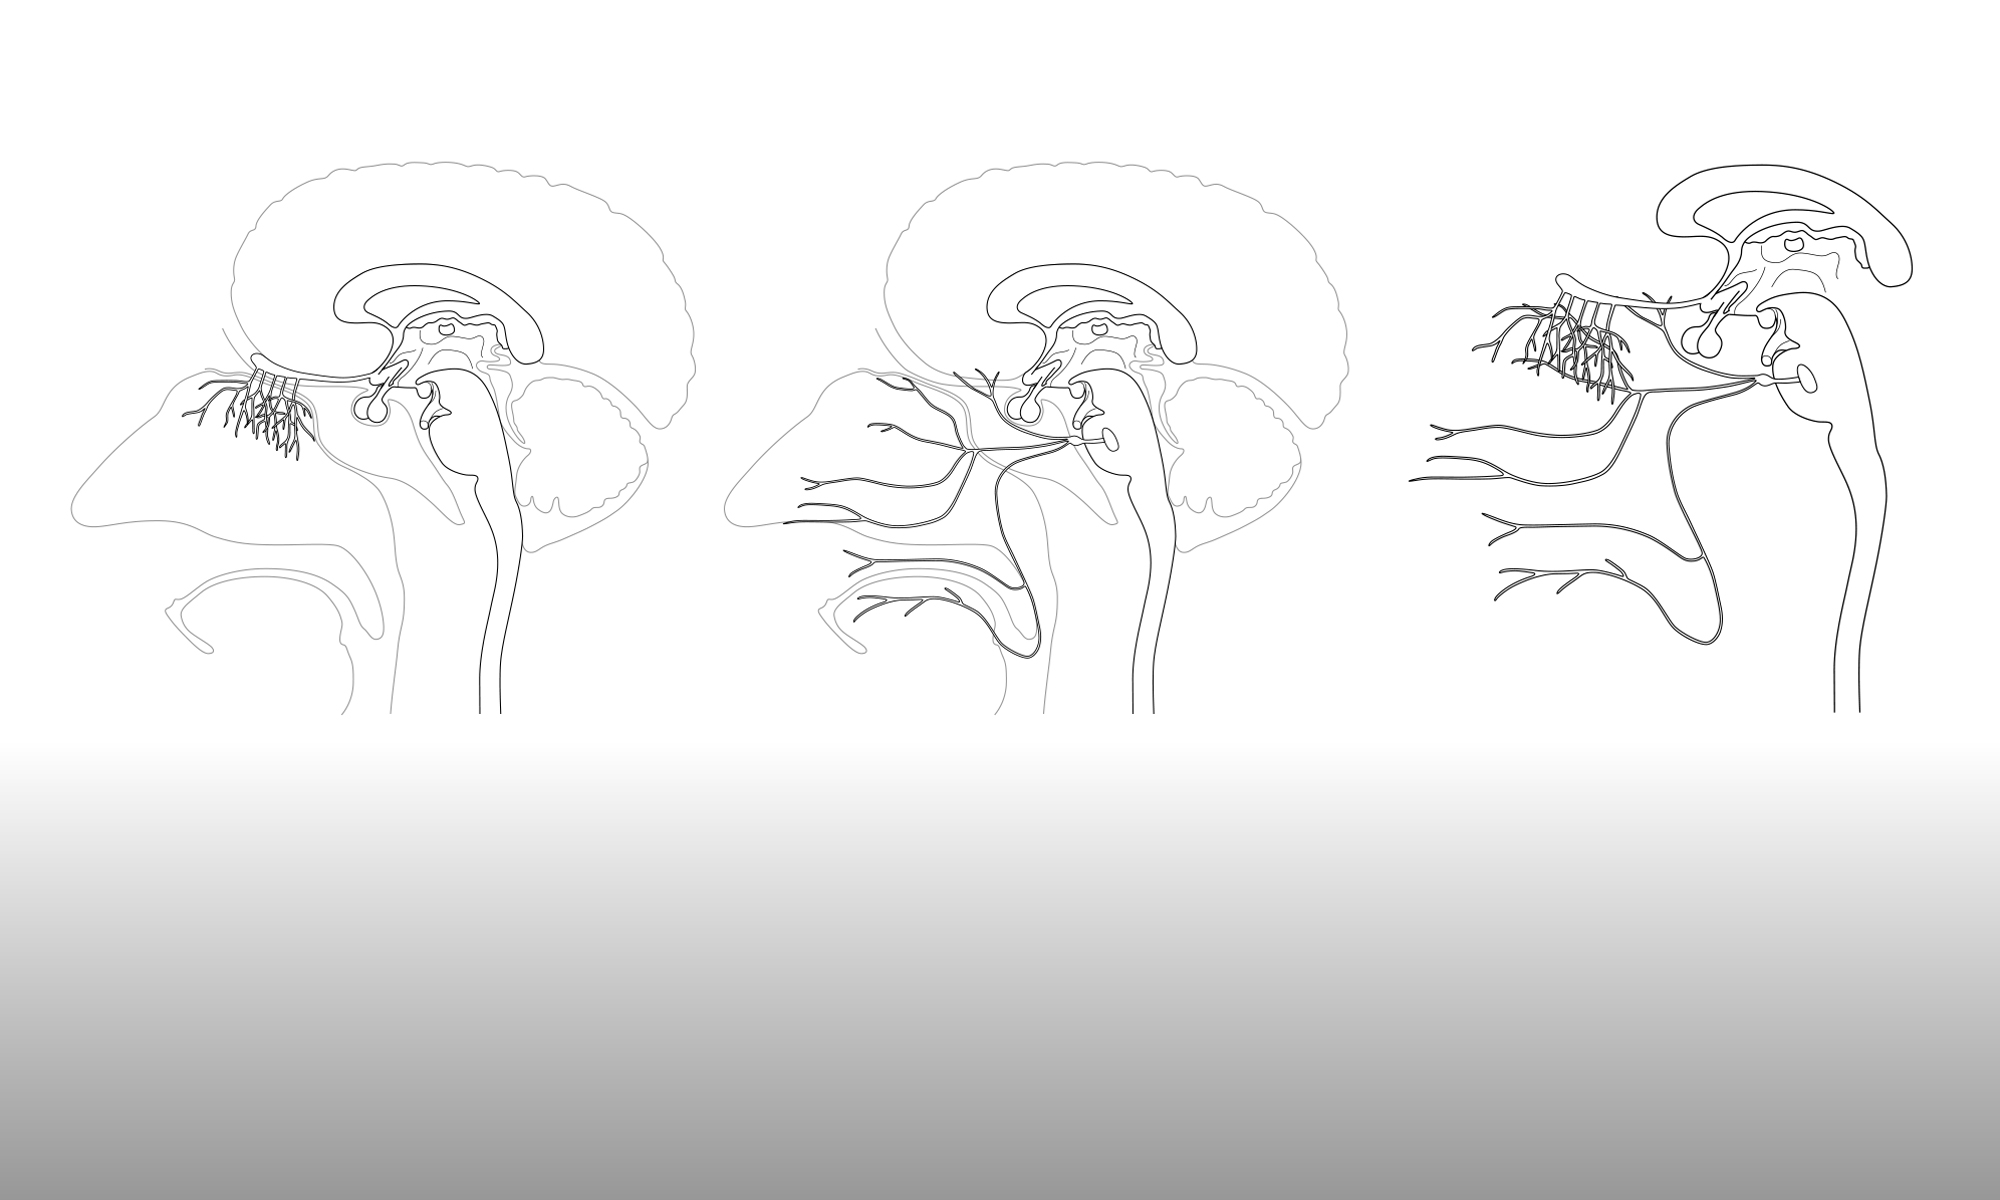

Using the visual elements that Gill had supplied (as described in the preceding blog post), Nisha constructed the images that she needed for figure 1 in her paper, which describes the experimental method. These images are shown below, as they are arranged in the figure (created in a single Adobe Illustrator file) but with text and annotation removed for now.
Gill will be meeting with Nisha to discuss how the figure was created, but some initial thoughts on the process:
Although the individual elements are quite detailed, they still work well, even at the very small scale required for this figure. Conceptual figures are often printed at a small scale, due to space restrictions on printed papers, so each element will have to communicate effectively at a variety of scales, hopefully without the need for any editing or simplification on the part of the scientist in order to make them work.
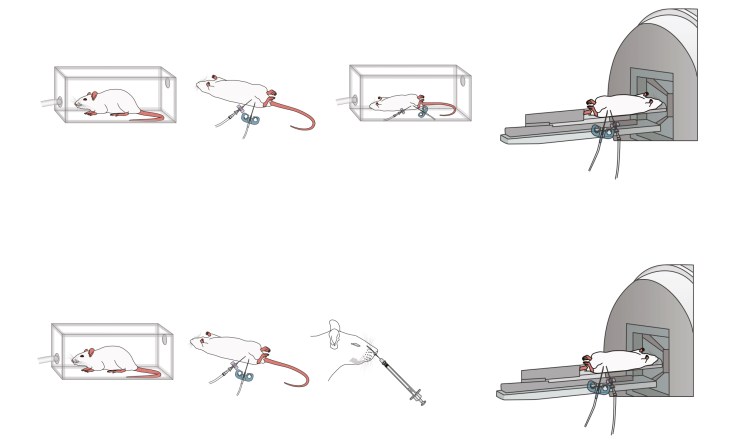
Nisha has some experience of using Illustrator and has successfully combined and cropped the supplied visual elements with no help from Gill. The scanner image, for example, combines four files – scanner, lying rat, cannula 1 and cannula 2 – into one image. Also, Gill had not supplied an image of the lying rat in the anaesthesia box, so Nisha had created this herself with the supplied elements. A scientist with less Illustrator experience may well need additional guidance / training in exactly how to combine several elements into one coherent image.
There are several ways of combining the elements within Illustrator:
- ‘placing’ an entire Illustrator file into a single layer of another Illustrator file
- ‘copying and pasting’ the entire contents of an Illustrator file, in one go, into a single layer of another Illustrator file
- ‘copying and pasting’ individual parts of an Illustrator file into separate layers of another Illustrator file.
Each method will give a different result, and allow different levels of integration of the two files. The header image to this blog post uses a ‘placed’ file for the lying rat but then an extra layer has been added to the scanner image to make the rat appear more integrated with the scanner (the rat’s tail disappears behind the scanner bed, for example). However, ‘placed’ files cannot be edited, and the weight of the rat’s outline is very different from the weight of the scanner outline, which may or may not be desirable in terms of creating a coherent image. Reducing the weight of the scanner outline may have helped in this case. In the scanner image Nisha generated for her figure, the rat is more in scale with the scanner then in the header image, but in this case both the rat and cannulas have a stronger outline than the scanner.
Ensuring the consistency in the visual appearance of combined elements will be important when trying to generate a coherent overall figure, rather than looking like a group of completely separate visual elements. The key to success for the library of visual elements will be to make them as easy to use, edit and combine as possible. We should also bear in mind that the resulting images are designed for an audience of scientists, not nan audience of graphic designers or illustrators. There has to be a balance between the success of the figure in terms of its visual communication to its audience and the amount of time and effort it requires on the part of an already busy scientist to create that figure. Therefore, the nuances of different line weights may not be regarded as that important, when compared to the visual communication of the figure as a whole.
Gill has added all of the visual elements that have been created for Nisha’s figure to the online image library. She has also drawn, and added, an image of the lying rat in the anaesthesia box, for future use.

One Reply to “”