

Gill and Nisha met to discuss Nisha’s research, in the field of intranasal drug delivery, and the conceptual figures that are typically used to visually communicate this work. Nisha had supplied Gill with several example papers from her field prior to the meeting (see a list of the papers at the bottom of this post). Gill had re-drawn the conceptual figures in Adobe Illustrator and dissembled some of them into their constituent visual elements, so that these could be reviewed during the meeting.
The following points were discussed:
- Dr Robert G. Thorne is the author or co-author of three of the papers that were reviewed (from 2004, 2012 and 2014). It is notable that most of the conceptual figures were used in more than one of these papers, with certain modifications. The figures used in the two later papers are all ‘signed’ with the initials RGT, suggesting Dr Thorne produces these figures himself. This would be unusual in the scientific community and is worth following up. (6th July 2017 – See this blog post for more information regarding Dr Thorne).
- Conceptual figures, particularly if they are the only such figure in an article, often contain a huge amount of information. This can make them difficult to read and decipher, even for an experienced viewer.
- Two of the figures (figure 1A from the 2012 paper and figure 1A from the 2009 paper – both shown below) are representing the same process but are visually very different. Although cell shapes are often indicative, based loosely on their actual appearance, the colours used can vary a great deal. If there is no set visual convention then the same element, such as the nasal mucus, can be represented completely differently.
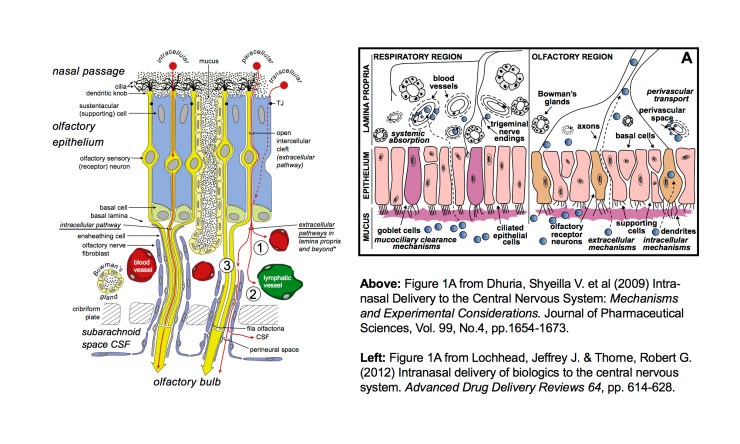
- Although some colour conventions are adhered to (red arteries, white and grey matter) most of the colours vary between the papers. While nerves are typically either yellow or black, other colours (blue epithelial cells, green lymph) are completely arbitrary. In Thorne’s 2004 paper, nerves are coloured red and blue, colours conventionally used for arteries and veins, which caused some temporary confusion. As figures may end up being printed in black and white, for cost reasons, the choice of colours can become even more important.
- Many of the papers include a figure showing a rat brain. Although the visual appearance and colours used in these figures varied significantly, they all include the outline of the large olfactory bulb and the distinctive structure of the cerebellum. This makes the figure instantly recognisable as the brain of a rat to a knowledgeable viewer.
Conceptual figures were re-drawn from these journal papers:
Dhuria, Shyeilla V. et al (2009) Intranasal Delivery to the Central Nervous System: Mechanisms and Experimental Considerations. Journal of Pharmaceutical Sciences, Vol. 99, No.4, pp. 1654-1673.
Lochhead, Jeffrey J. et al (2014) Rapid transport within cerebral perivascular spaces underlies widespread tracer distribution in the brain after intranasal administration. Journal of Cerebral Blood Flow & Metabolism, Vol. 35, pp. 371-381.
Lochhead, Jeffrey J. & Thorne, Robert G. (2012) Intranasal delivery of biologics to the central nervous system. Advanced Drug Delivery Reviews, 64, pp. 614-628.
Piazza, Justin E. et al (2015) A Novel Intranasal Spray Device for the Administration of Nanoparticles to Rodents. Journal of Medical Devices, Vol. 9.
Scranton, Robert A. (2011) The Rostral Migratory Stream Plays a Key Role in Intranasal Delivery of Drugs into the CNS. PLoS ONE, Vol. 6, No. 4, e18711
Thorne, Robert G. et al (2004) Delivery of insulin-like growth factor-1 to the rat brain and spinal cord along olfactory and trigeminal pathways following intranasal administration. Neuroscience 127, pp. 481-496.

2 Replies to “Meeting between Gill and Nisha, Friday 2nd June 2017”